How do I set up my chart of accounts?
Every budget starts with a chart of accounts. Each period keeps its own chart, so account numbers can change from year to year.
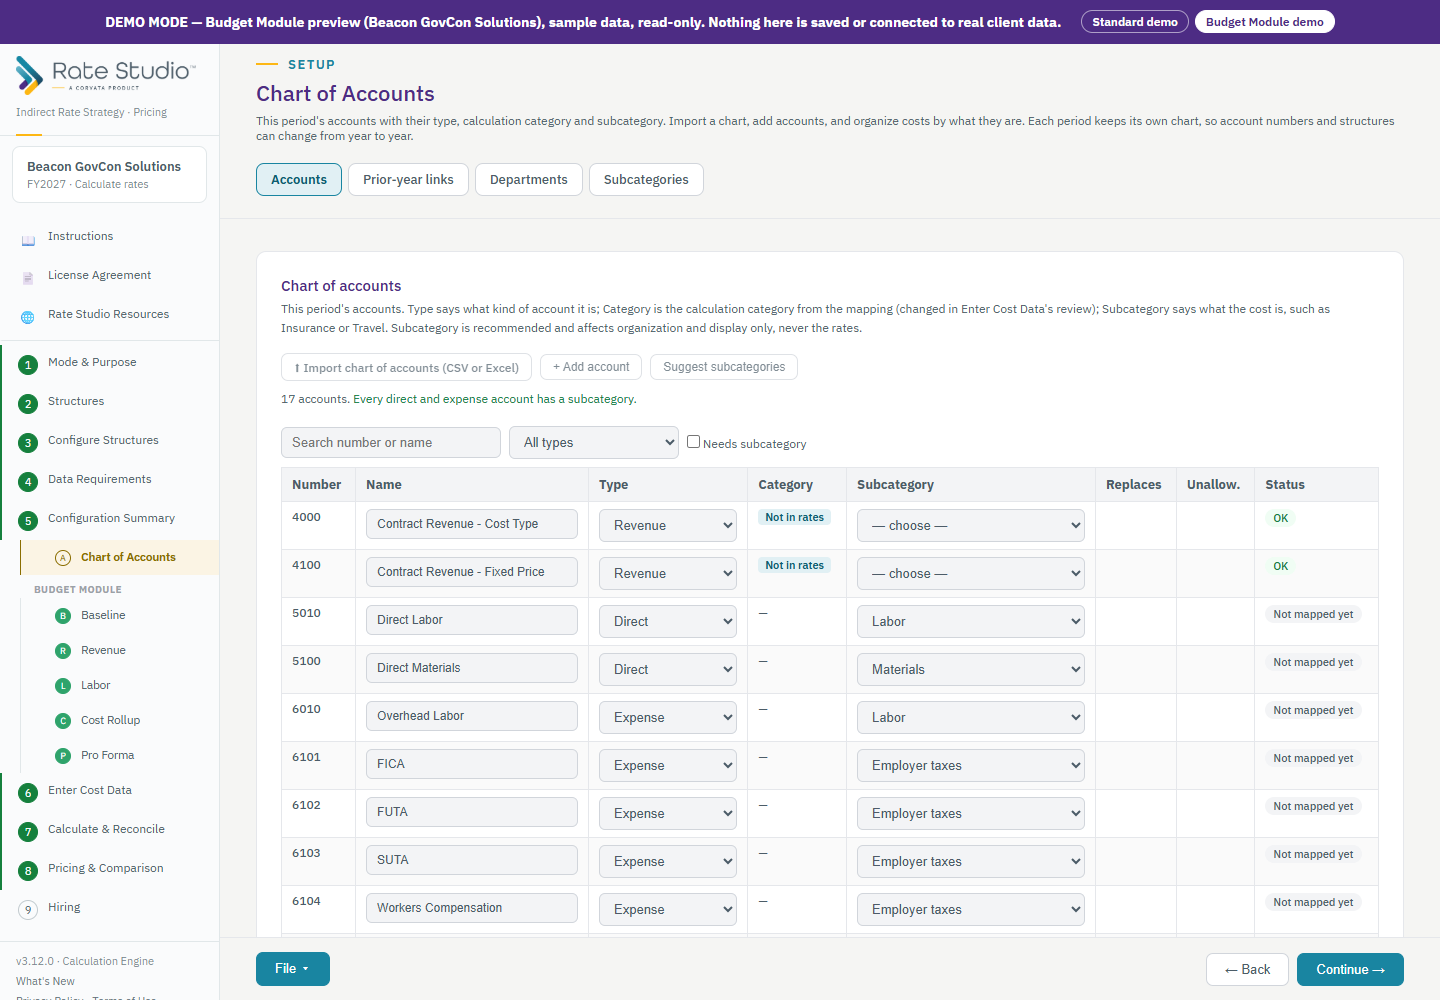
What each field means
- Type says what kind of account it is: Asset, Liability, Capital/Equity, Revenue, Direct, Expense or Other.
- Category is how the account is treated in the rate calculation.
- Subcategory says what the cost is, such as insurance or travel. It is recommended, not required, and it never changes your rates.
Steps
- Open Chart of Accounts and the Accounts tab.
- Import your chart from a CSV or Excel file. Only posting accounts come in. If the period already has accounts, Rate Studio asks whether to replace the chart, update and add, or add new accounts only.
- To add one account, choose Add account and enter the number, the name and the type.
- Use the Needs subcategory filter to see what is missing, then choose Suggest subcategories for a first pass.
- Optionally add Departments: an optional reporting layer under your pools. Add a department and choose its pool. It can appear in your GL export and never changes a rate.
Last year's accounts
If your chart changed since the baseline year, the Prior-year links tab connects each older account to its new one (see How do prior-year account links work?).
If this doesn't work: if accounts show as unmapped when you export, see The budget export is disabled.
Watch: Chart of Accounts, from 0:13
Full guide section: Budget Module
Related: How do prior-year account links work? | How do I load a baseline (prior year and year to date)? | How do I map GL accounts and export the budget?